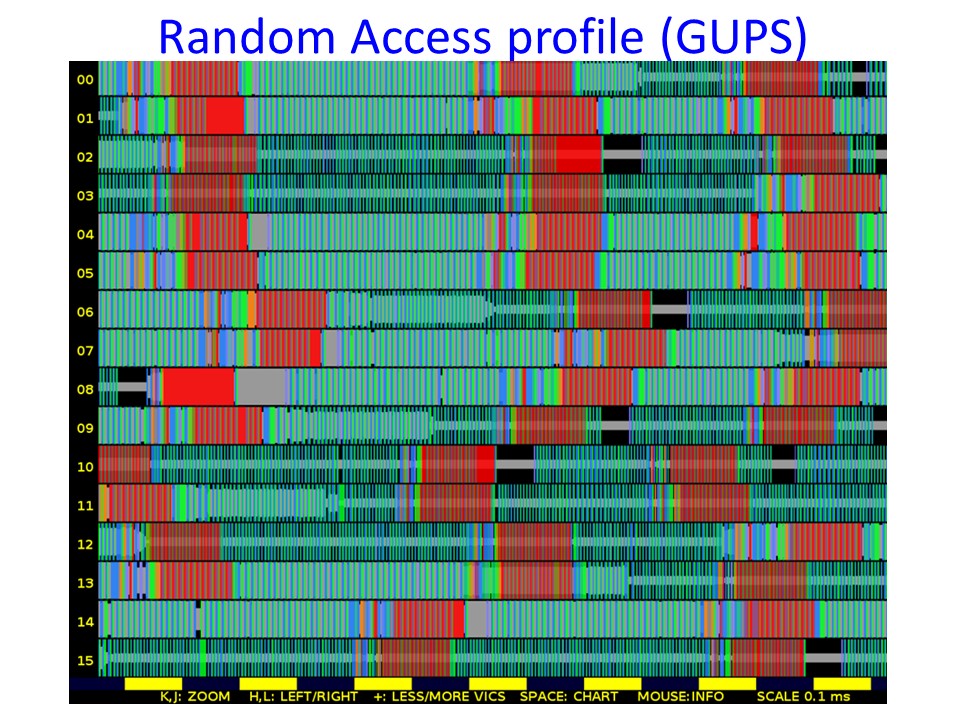
Data Vortex Profiler

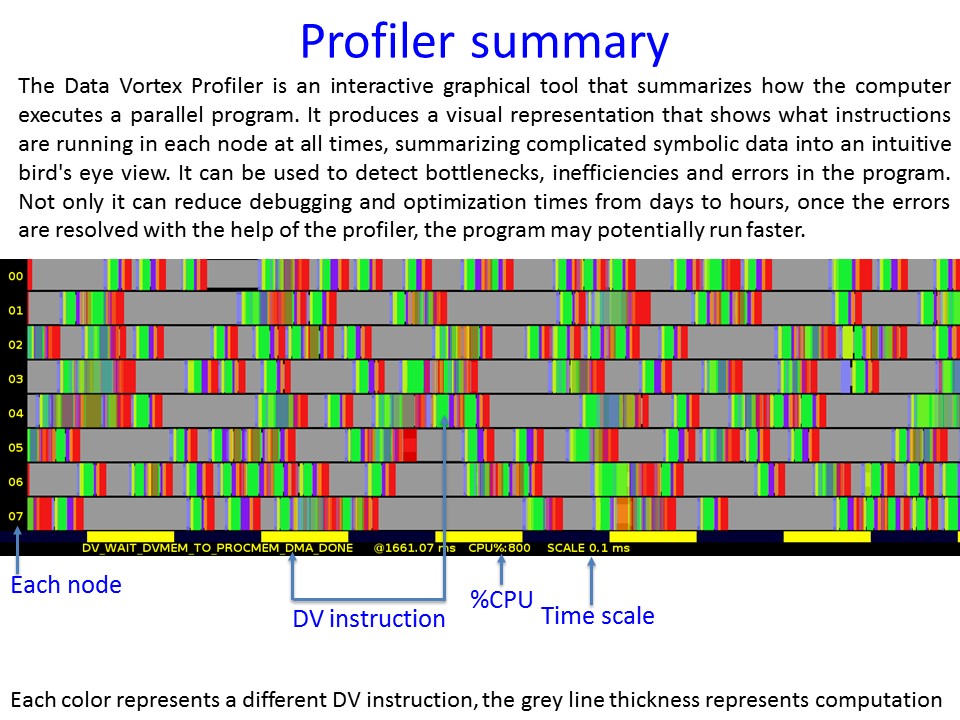
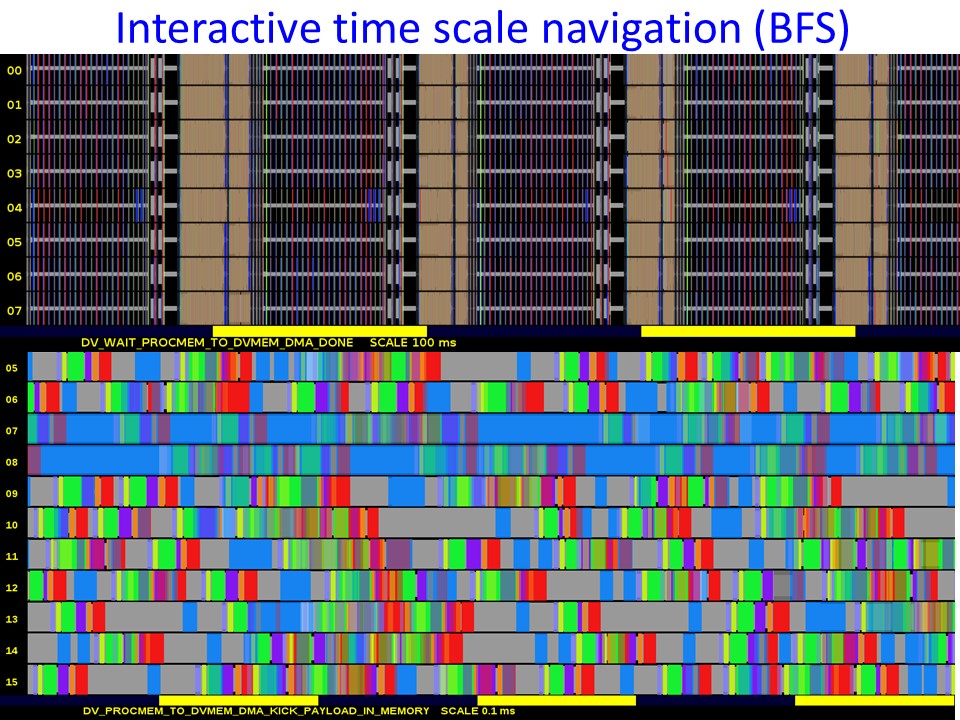
Each color represents a different Data Vortex function. This figure shows how the time scale can be changed interactively in order to show a smaller time interval.
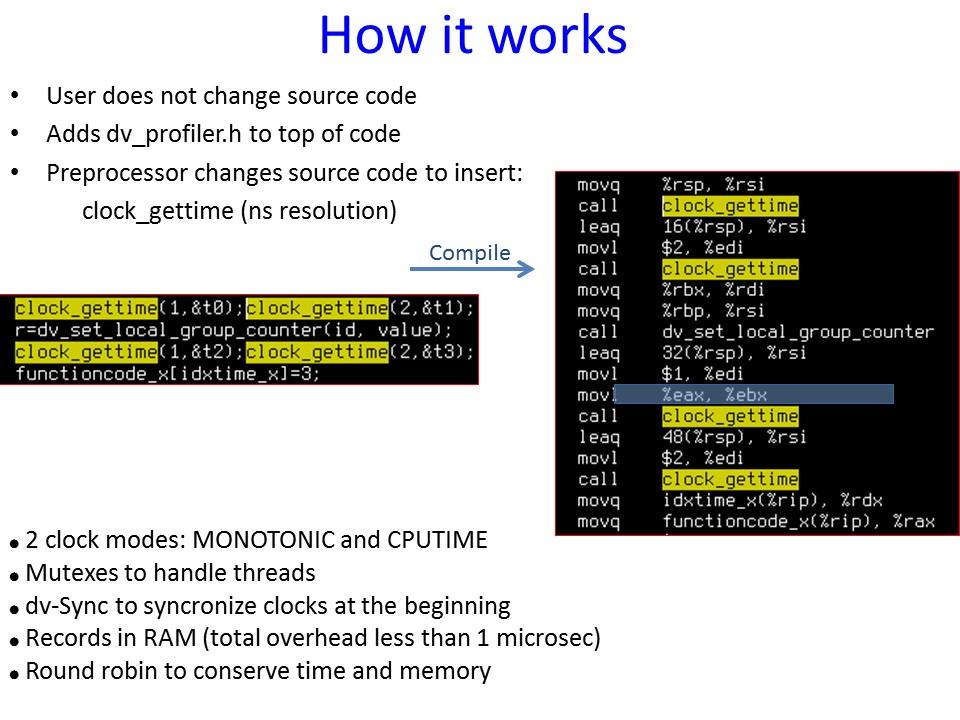
The user does not need to modify the code to run a profile. The C preprocessor automatically inserts timing calls into the code and generates the graph with a small time penalty of the order of 10%.
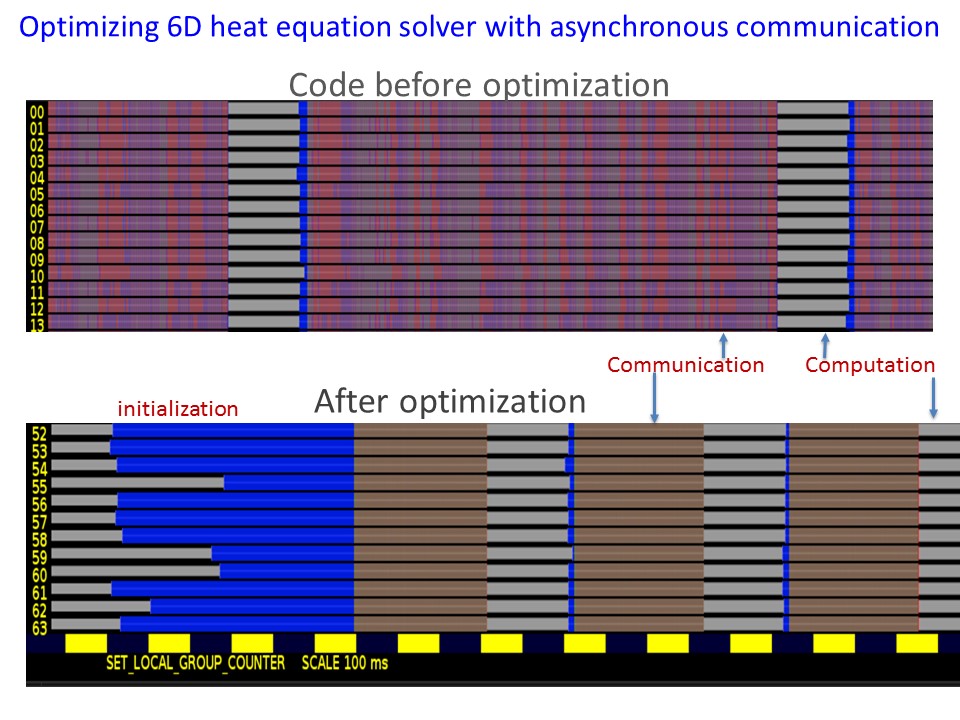
With the help of the profiler, the user can dramatically accelerate the code. Here the profiler was used to improve a finite differences heat equation solver in six dimensions.