Simulating Quantum Computers with Data Vortex
(In Progress)

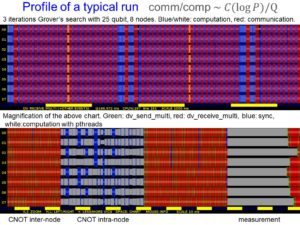
The quantum circuit profiler is a tool that we developed to assist on the design and debugging of quantum programs. It consists of three components: the top part shows the evolution of a selection of the quantum basis states (in this example, the neighborhood of the maximum probability state) colorized according to their complex amplitude, the bottom left shows the circuit with a history of the last executed gates, and the bottom right shows the current covariance matrix between qubits, which gives an indication of their degree of entanglement. Color coded markers show which qubits are being accessed. A real quantum computer cannot show this information to the user because the registers undergo quantum collapse when a measurement is attempted. In the example above we illustrate the profiler with the evolution of a small instance of Grover's algorithm.
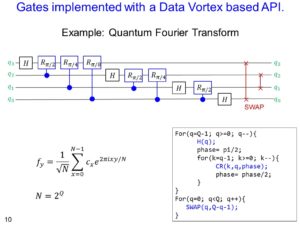
The profiler was designed to work with larger programs, here is a QFT with noisy data. The noise level was adjusted so the probability of success is near 50%.
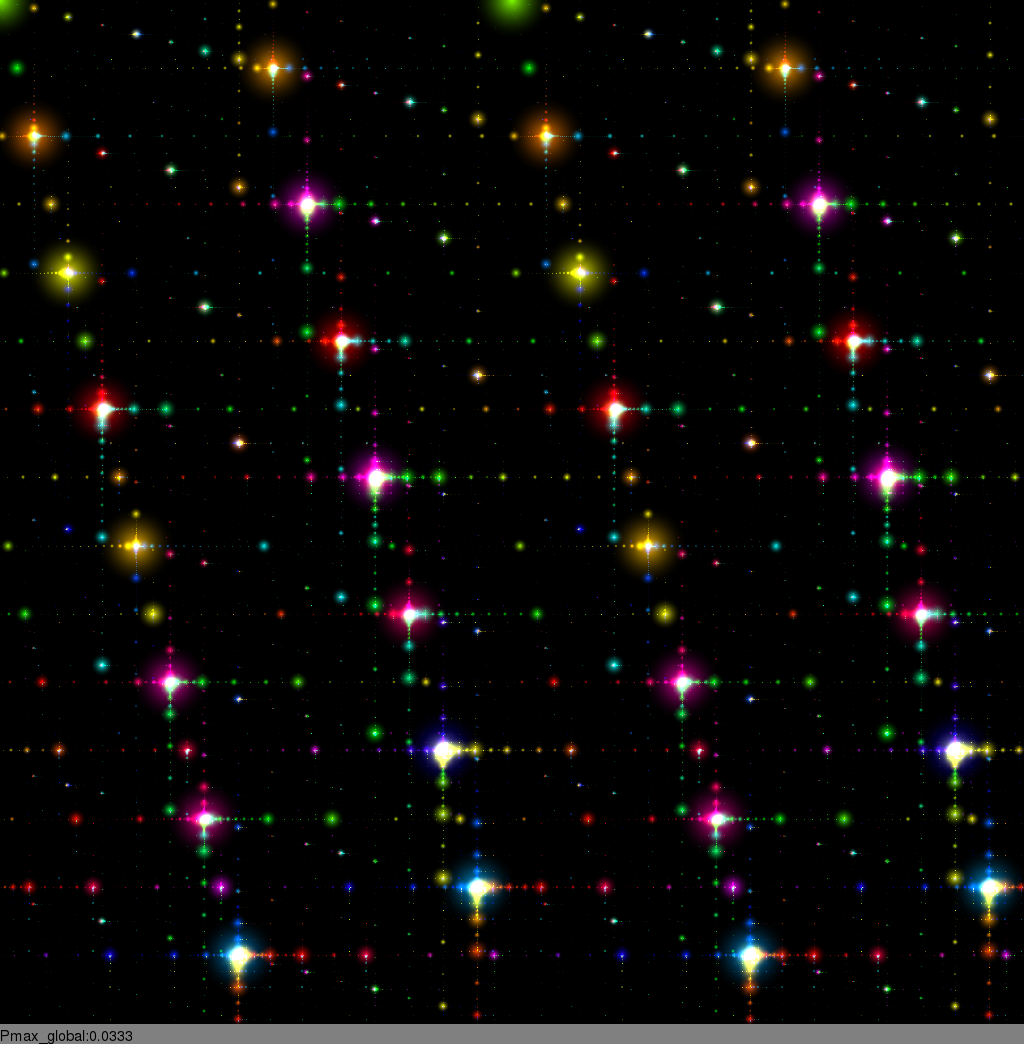
Visualization of the amplitudes after executing Shor's algorithm with the approximate Quantum Fourier Transform. This image was created with a mathematical model that summarizes terabytes of data distributed among 32 nodes.